Selected Product
Sensometer Pro
Industrial-grade hardware for heavy-duty facility integration and multi-zone AC control.
Detailed specifications were not provided for this product.

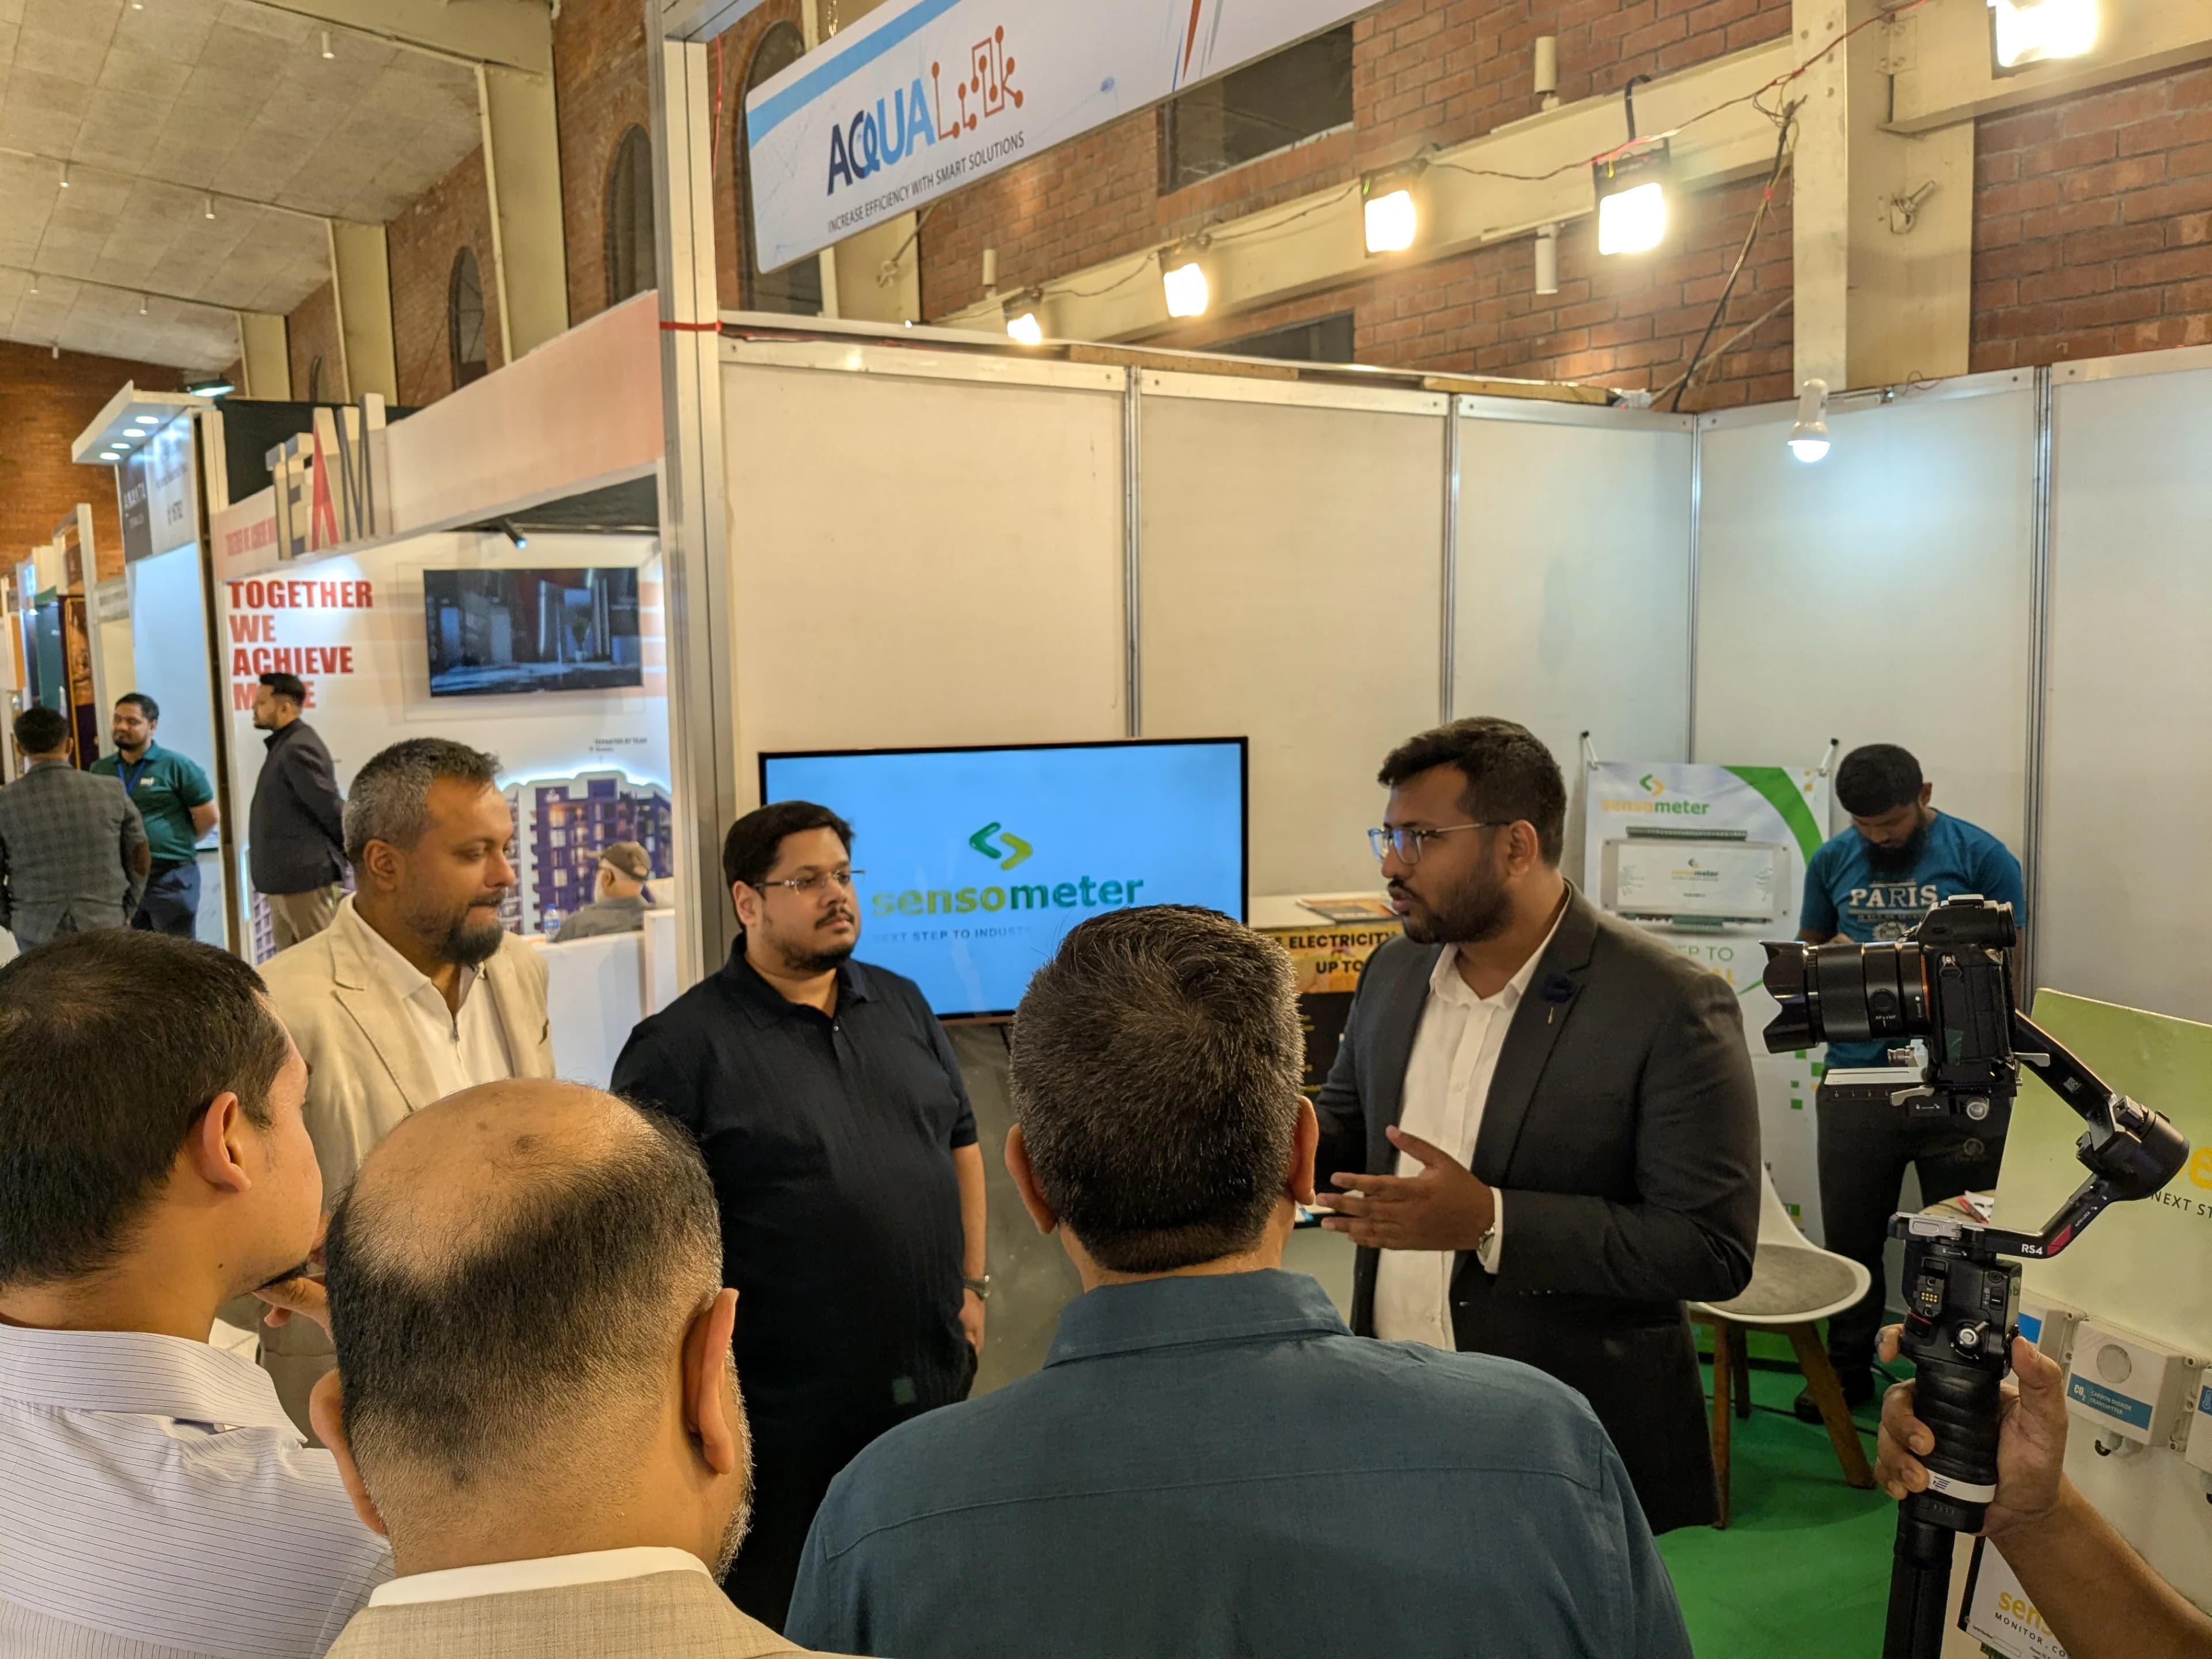
Energy automation, facility IoT, and sustainability analytics
Turn Energy Drain into Smart Gain
Sensometer connects plug-and-play hardware to analytical dashboards that help retail shops, commercial facilities, and farms reduce energy cost, carbon output, and operational waste.
Overview
Sensometer helps retail chains, factories, commercial facilities, and enterprise agribusinesses automate energy-heavy operations. Its hardware ecosystem and cloud dashboard support smart AC scheduling, climate zoning, live utility analytics, multi-branch visibility, field diagnostics, and measurable sustainability reporting.
Industry
Energy automation, facility IoT, and sustainability analytics
Business Model
Smart hardware deployment with cloud analytics dashboard
Energy Saved
20%+
Automated smart climate zoning lowers monthly corporate utility bills.
Payback
< 6 months
Hardware and installation costs can be recovered through energy savings in under half a year.
Carbon Cut
300+ tons
Measurable carbon reductions support ESG and climate goals.
Clients
90+
Deployed across industrial sites, retail networks, and commercial farms.
Selected Product
Industrial-grade hardware for heavy-duty facility integration and multi-zone AC control.
Adjust cooling automatically based on real-time occupancy, room temperature, and branch schedules.
Ensure heavy-drain appliances do not run at full power in empty spaces.
Connect smart hardware quickly across stores, commercial facilities, and agricultural environments.
Give executive teams and facility managers live control through mobile and desktop dashboards.
Track real-time consumption charts, active AC schedules, and operational trends from anywhere.
Key Intelligence
A high-scannable proof banner for retail chain executives, facility managers, and enterprise agribusinesses.
| Impact Number | Core Headline | Brief Explainer |
|---|---|---|
| 20%+ | Energy Saved | Instantly lowers monthly corporate utility bills through automated smart climate zoning. |
| < 6 Months | Guaranteed Payback | Hardware and installation costs are recovered through energy savings in under 6 months. |
| 300+ Tons | Carbon Emissions Cut | Direct, measurable reductions in carbon output help companies hit ESG goals. |
| 90+ | Enterprise Clients | Deployed and trusted across industrial sites, retail networks, and commercial farms. |
Success Stories
From outlets to insights: replacing manual controls with automated smart scheduling proved that sustainability can directly drive profitability.

Active across 21 outlets, tuning AC cooling by occupancy and room temperature

Smart climate zone scheduling stops heavy-drain appliances running in empty spaces.
Key Intelligence
Sensometer supports operational efficiency and measurable SDG-aligned sustainability outcomes.
SDG alignment
Local operational efficiency, carbon reduction, and resource stewardship are mapped to the sustainability goals below.

Smart IoT automation for traditional sectors.

Lower strain on local power grids during peak loads.

Mitigate daily energy waste through smarter operating schedules.

Lower greenhouse gases with a 300+ ton carbon saving track record.


Preserve resources through automated water quality and agriculture tools.
Visual Archive
Open any image to browse the connected gallery with details and related previews.